Please can some one explain this diagram ?

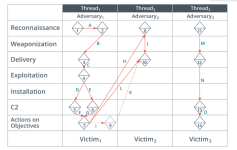
So this is the Diamond Model of Intrusion Analysis focuses on relationships between features of an attack. In its most basic form, the model maps out the four core features of an event, or one stage of the intrusion: “an adversary deploys a capability over some infrastructure against a victim.”

Pages 32 and 33 of the below paper are the narrative to this particular illustration.


/r
 
Each diamond in the graphic shows adversary activity along the top and victim activity along the bottom.
Links from the right side of a diamond represent the use of a capability. Links from the left side of a diamond represent involvement of some infrastructure.
In this graphic the diamonds are annotated 1,2, 3,... to show the order of operations as they might appear on a timeline.
In this report the adversary used capabilities of Victim1 to recon (H) and deliver weapons (L and possibly K) to Victim2.
Also note steps 5 and 6. It looks like the adversary shifted their C2 (command and control). That and no info at the Installation row makes me believe that some time passed between 4 and 5&6.
 
As Rick pointed out, it's the Diamond Model of Intrusion.

Look at the image as if it is telling a story.
Solid lines are referring to actual events. Dotted lines are hypotheses.

Let's follow the numbers in the diamonds.

1. The adversary conducted a reconnaissance on Victim 1.
2. From the result of action 1 reconnaissance, the adversary conducted further recon
3. The adversary now delivers the attack to Victim 1
4. The exploit has been executed/ ran
5. Along with the exploit is a hook with the adversary's C2C server (command and control)
6. Along with the exploit is another server of the advsersary (probably a backup C2C)
7. The adversary does what it wants to do
8. From Victim 1, the adversary is able to pivot to do reconnaissance attack against Victim 2.
9. [this is a dotted diamond, referring to a hypotheses, not an actual event] the adversary went back to Victim 1 i.e. check on data perhaps
10. The adversary now delivers the attack to Victim 2
11. The adversary conducted a reconnaissance on Victim 3.
12. The adversary delivers the attack to Victim 3
13. C2C connection is established with Victim 3.
14. The adversary does what it wants to do
EXCELLENT (y) :giggle:
 
  • Like
Reactions: Jarrel